


In a startup, there are a lot of things to do and not a lot of time or people to do them. One of the things that is really important is getting your data stack right. An excellent place to start is the A16Z article outlining an emerging data architecture. But, there are still choices to make.
Here is an outline of how to go from zero to full stack analytics platform in about a day.
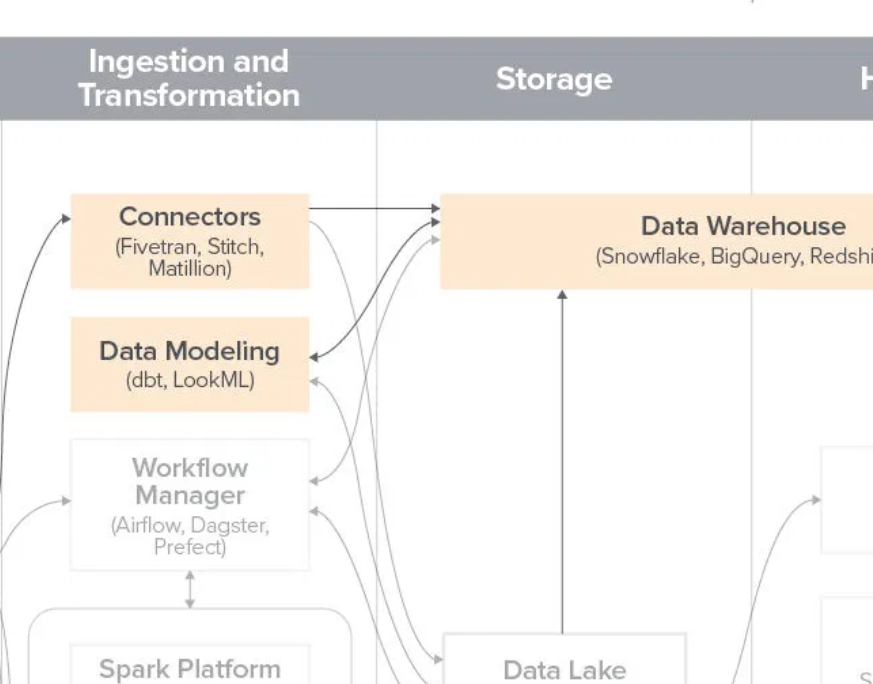
Data Warehouse
There are a few good choices for a data warehouse. For a small startup, the choice usually comes down to operational burden. For that reason, I recommend Google Bigquery. It’s very easy to set up, cheap to operate, and has a great set of integrations. Product managers I’ve worked with love being able to work in a Google Sheet and then join with data in the warehouse to perform analytics. The cost is based on the volume of data you query over, so if you don’t use it, it’s very cheap. Because Google hosts it, you don’t have to worry about upkeep, maintenance, and performance tuning. It’s not always the fastest, but response times are interactive for all but the most intense queries.
The other contenders here are AWS Redshift and Snowflake. AWS is a good choice if you’re on the platform, need something you can control/optimize, have some operational experience, and are ok paying by the hour. Snowflake is a data warehouse that’s easier to operate than Redshift, but more expensive and harder than Bigquery, but also more flexible and expensive.
Data Modeling
I use dbt as a layer in between my raw data and user-accessible tables. dbt is a tool built for analytic teams to organize data, document schema, and build metrics. Using dbt, analysts can use software development best practices and workflows for their analytics and pipelines.
This data modeling layer layer is not strictly required. However, as you grow your analytics team, it’s a good thing to add in. It can also solve some pain points around performance and cost on BQ by materializing views and refreshing them on a regular schedule. It’s about $50/month for a developer seat for the hosted version. You can also roll your own or use the fivetran (or other ELT provider) integration.
Visualization
I prefer to use metabase for the visualization BI layer. It’s about $100/month for the hosted version. You get permissions and roles, lots of visualization and self serve options, and the ability to schedule reports delivered by slack or email. I’ve found that a weekly analytics report mailed to the CEO goes a long way towards building trust.
ELT
ELT is extract, load, transform. This layer is the data engineering component you need to get data out of one database or SaaS tool and into your data warehouse. For this layer I have 2 recommendations: fivetran and segment.com.
Depending on your use case, you might be able to get away using either Segment or Fivetran. Fivetran has great connectors for many SaaS apps, but also for your datbases. If you are using postgres, mongo, or most any other storage system for your data, you can connect Fivetran to it and move the data to your data warehouse. Meanwhile, Segment does not support ELT from databases, but has a much richer set of connectors for other applications. It also has good analytics libraries you can use to instrument your product (front or back end).
Between these two SaaS tools, you’ll be able to get data from just about any source you have and generate new metrics and events to send to your data warehouse for analysis. Segment will cost about $120/month for the base plan (10K named users) and gets prorated if you use more. Fivetran pricing is honestly kind of complex. In my experience, for a connector with a small amount of data it’s been between $20-50/month. However, I’ve seen $3K/month bills when moving a lot of logging data. Fortunately, when you add a new connector, you get a 14 day free trial to figure out how much data is going to move and what it will cost.
Conclusion
So there you have it! These are the tools you need. They’ll get the data flowing from your app and data silos into a data warehouse, they’ll organize it, and as a result, you’ll be able to create some slick reporting. If you want a hand or need more, please reach out! We are always glad to help.